-
Associated Capital Group, Inc. Reports Fourth Quarter and Full Year Results
Source: Nasdaq GlobeNewswire / 06 Feb 2024 19:07:28 America/New_York
- Book Value was $42.11 per share at year-end 2023 vs. $40.48 a year ago
- Year-end AUM: $1.59 billion at December 31, 2023 vs. $1.84 billion at December 31, 2022
- $4.0 million of donations completed in January 2024 to shareholder designated 501(c)(3) charitable organizations brought the total giving to $38 million since our spin-off in 2015
- The Board of Directors authorized the repurchase of up to an additional 350,000 shares
GREENWICH, Conn., Feb. 06, 2024 (GLOBE NEWSWIRE) -- Associated Capital Group, Inc. (“AC” or the “Company”), a diversified financial services company, today reported its financial results for the fourth quarter and full year-ended December 31, 2023.
Financial Highlights – GAAP basis ($’s in 000’s except AUM and per share data) Fourth Quarter Full Year (Unaudited) 2023 2022 2023 2022 AUM – end of period (in millions) $ 1,591 $ 1,842 $ 1,591 $ 1,842 AUM – average (in millions) 1,581 1,811 1,659 1,817 Revenues 5,636 7,538 12,683 15,228 Operating loss before management fee (Non-GAAP) (2,451 ) (2,616 ) (11,501 ) (11,262 ) Investment and other non-operating income/(loss), net 26,672 19,550 63,812 (49,203 ) Income/(loss) before income taxes 21,850 16,934 46,865 (60,465 ) Net income/(loss) 16,342 13,664 37,451 (48,907 ) Net income/(loss) per share-diluted $ 0.76 $ 0.62 $ 1.72 $ (2.22 ) Class A shares outstanding (000’s) 2,587 3,027 2,587 3,027 Class B “ “ 18,951 18,963 18,951 18,963 Total “ “ 21,538 21,990 21,538 21,990 Book Value per share $ 42.11 $ 40.48 $ 42.11 $ 40.48 Giving Back to Society – (Y)our “S” in ESG
AC seeks to be a good corporate citizen by supporting our community through sponsoring local organizations. On August 9, 2023, the Board of Directors approved a $0.20 per share shareholder designated charitable contribution ("SDCC") for registered shareholders. This was an increase from last year’s $0.15 per share contribution. Based on the program created by Warren Buffett at Berkshire Hathaway, our corporate charitable giving is unique in that the recipients of AC's charitable contributions are chosen directly by our shareholders, rather than by our corporate officers. In the first quarter of 2024, we completed the distribution of approximately $4.0 million to various organizations selected by our shareholders for our 2023 program. Since our spin off as a public company, the shareholders of AC have donated approximately $38 million, including the most recent SDCC, to over 190 501(c)(3) organizations that address a broad range of local, national and international concerns.
Fourth Quarter Financial Data
- Assets under management ended the quarter at $1.59 billion, in line with September 30, 2023 and compared to $1.84 billion at December 31, 2022.
- At December 31, 2023, book value per share was $42.11 per share versus $41.43 per share at September 30, 2023 and $40.48 per share at December 31, 2022.
Fourth Quarter Results
Fourth quarter revenues were $5.6 million compared to $7.5 million for the fourth quarter of 2022, based on lower average AUM and lower performance-based fees in 2023.
Total operating expenses, excluding management fee, were $2.1 million lower, $8.1 million in the fourth quarter 2023 compared to $10.2 million in the comparable 2022 period, principally due to lower variable performance-based compensation expense in 2023 driven by lower revenues.
Net investment and other non-operating income was $26.7 million for the fourth quarter, an increase of $7.1 million from the $19.6 million recorded in the year ago quarter, reflecting the appreciation of our equity portfolios in this year’s fourth quarter in addition to interest income in the current quarter.
The fourth quarter of 2023 includes a Management fee of $2.4 million versus none in the fourth quarter of 2022 due to losses. Our provision for income taxes was $5.6 million for the quarter compared to $2.9 million in the comparable period of 2022.
Full Year Results
Revenues for the year-ended 2023 were $12.7 million compared to $15.2 million in 2022, based on lower average AUM and lower performance-based fees in 2023.
For 2023, the operating loss before Management fee was $11.5 million compared to $11.3 million in 2022.
The full year 2023 net investment and other non-operating income swung from a loss of $49.2 million in 2022 to a $63.8 million gain, primarily due to mark-to-market changes in our holdings of our securities portfolio.
In 2023, Management fee was $5.4 million. There was no Management fee in 2022 due to pre-tax losses in that period.
Our income tax rate for the year was 19.5% compared to 24.7% for the prior year primarily driven by deferred tax benefits from a foreign investment that reduced the current period’s effective tax rate.
Assets Under Management (AUM)
Assets under management ended the year at $1.59 billion, $251 million less than year-end 2022, reflecting net outflows of $325 million, offset partially by market appreciation of $68 million and the impact of currency fluctuations in non-US dollar denominated classes of investment funds of $6 million. In the merger arbitrage strategy, most of the outflows ($265 million) were tied to GAMCO Merger Arbitrage UCITS (a Luxembourg entity organized as an Undertaking for Collective Investment in Transferrable Securities). These outflows were generally driven by our clients including wealth managers, bank platforms and insurance companies reallocating funds to other asset classes.
AUM since spin-off:
December 31, ($ in millions) 2023 2022 2021 2020 2019 2018 2017 2016 2015 Merger Arbitrage $ 1,312 $ 1,588 $ 1,542 $ 1,126 $ 1,525 $ 1,342 $ 1,384 $ 1,076 $ 869 Long/Short Value(a) 244 222 195 180 132 118 91 133 145 Other 35 32 44 45 59 60 66 63 66 Total AUM $ 1,591 $ 1,842 $ 1,781 $ 1,351 $ 1,716 $ 1,520 $ 1,541 $ 1,272 $ 1,080 (a) Assets under management represent the assets invested in this strategy that are attributable to AC.
Alternative Investment Management
The alternative investment strategy offerings center around our merger arbitrage strategy which has an absolute return focus of generating returns independent of the broad equity and fixed income markets. We also offer strategies utilizing fundamental, active, event-driven and special situations investments.
Merger Arbitrage
For the fourth quarter 2023, our longest continuously offered fund in the merger arbitrage strategy generated gross returns of 3.19% (2.35% net of fees). For the full year, gross returns were 5.49% (3.56% net of fees), adding to its historical record of positive net returns in 37 of the last 39 years. A summary of the performance is as follows:
Full Year Performance%(a) 4Q '23 4Q '22 2023 2022 2021 2020 2019 5 Year(b) Since 1985(b)(c) Merger Arb Gross 3.19 4.40 5.49 4.47 10.81 9.45 8.55 7.73 10.08 Net 2.35 3.45 3.56 2.75 7.78 6.70 5.98 5.33 7.14 (a) Net performance is net of fees and expenses, unless otherwise noted. Performance shown is for an actual fund in this strategy. The performance of other funds in this strategy may vary. Past performance is no guarantee of future results.
(b) Represents annualized returns through December 31, 2023
(c) Inception Date: February 1985
Merger Arbitrage returns are driven in part by deal activity. In 2023, worldwide M&A totaled $2.9 trillion, a decrease of 17% compared to 2022 activity. However, fourth quarter deal making increased 23% sequentially compared to third quarter 2023, an encouraging sign that deal making may be recovering. The US remained a bright spot for deal activity with deal volume of $1.4 trillion, accounting for 47% of worldwide M&A (compared to 42% in 2022). Energy & Power was the most active sector with deal volume that totaled $502 billion, accounting for 17% of overall value. Industrials, Technology and Healthcare M&A each accounted for 13% of total M&A in 2023. Private Equity acquisitions totaled $566 billion, accounting for 20% of total deal activity.
Since inception in 1985, our longest continuously offered fund in the merger arbitrage strategy has consistently outperformed the return on 90-day T-Bills. The summary historical performance is as follows:

Merger Arbitrage(1) Percent Return (%) Year Gross Return
Net Return90 Day
T-Bills2023 5.49 3.56 5.26 2022 4.47 2.75 1.50 2021 10.81 7.78 0.05 2020 9.45 6.70 0.58 2019 8.55 5.98 2.25 2018 4.35 2.65 1.86 2017 4.69 2.92 0.84 2016 9.13 6.44 0.27 2015 5.33 3.43 0.03 2014 3.89 2.29 0.03 2013 5.33 3.43 0.05 2012 4.32 2.63 0.07 2011 4.89 3.07 0.08 2010 9.07 6.35 0.13 2009 12.40 9.15 0.16 2008 0.06 -0.94 1.80 2007 6.39 4.26 4.74 2006 12.39 8.96 4.76 2005 9.40 6.63 3.00 2004 5.49 3.69 1.24 2003 8.90 6.26 1.07 2002 4.56 2.45 1.70 2001 7.11 4.56 4.09 2000 18.10 13.57 5.96 1999 16.61 12.31 4.74 1998 10.10 7.21 5.06 1997 12.69 9.21 5.25 1996 12.14 8.84 5.25 1995 14.06 10.27 5.75 1994 7.90 5.53 4.24 1993 12.29 8.91 3.09 1992 7.05 4.78 3.62 1991 12.00 8.76 5.75 1990 9.43 6.67 7.92 1989 23.00 17.55 8.63 1988 45.84 35.66 6.76 1987 -13.67 -14.54 5.90 1986 33.40 26.14 6.24 1985 30.47 22.64 7.82 Average 10.46 7.40 3.27 (1) The performance above refers to our longest continuously offered fund in the merger arbitrage strategy (net and gross returns). Net returns are net of management and incentive fees. Individual investment returns may differ due to timing of investment and other factors. Past performance is not indicative of future results.
The Merger Arbitrage strategy is offered by mandate and client type through partnerships and offshore corporations serving accredited as well as institutional investors. The strategy is also offered in separately managed accounts, a Luxembourg UCITS and a London Stock Exchange listed investment company, Gabelli Merger Plus+ Trust Plc (GMP-LN).
Acquisitions
Associated Capital Group's plan is to accelerate the use of its capital. We intend to leverage our research and investment capabilities by pursuing acquisitions and alliances that will broaden our product offerings and add new sources of distribution. In addition, we may make direct investments in operating businesses using a variety of techniques and structures to accomplish our objectives.
Shareholder Dividends and Buybacks
At its meeting on November 8, 2023, the Board of Directors declared a semi-annual dividend of $0.10 per share, which was paid on December 14, 2023 to shareholders of record on December 1, 2023.
During the fourth quarter, AC repurchased 85,342 Class A shares, for $2.9 million, at an average price of $34.50 per share. Furthermore, for the full year AC repurchased 452,688 Class A shares, for $16.3 million, at an average price of $36.06 per share.
On February 6, 2024, the Board of Directors authorized the repurchase of up to an additional 350,000 shares. The Company intends to continue to repurchase additional shares, but share repurchases may vary from time to time and will take into account macroeconomic issues, market trends, and other factors that the Company deems appropriate.
Since our spin-off from GAMCO on November 30, 2015, AC has returned $172.4 million to shareholders through share repurchases and exchange offers, and paid dividends of $36.4 million.
At December 31, 2023, there were 2.587 million Class A shares and 18.951 million Class B shares outstanding.
About Associated Capital Group, Inc.
Associated Capital Group, Inc. (NYSE:AC), based in Greenwich, Connecticut, is a diversified global financial services company that provides alternative investment management through Gabelli & Company Investment Advisers, Inc. (“GCIA”). We have also earmarked proprietary capital for our direct investment business that invests in new and existing businesses. The direct investment business is developing along several core pillars, including Gabelli Private Equity Partners, LLC (“GPEP”), formed in August 2017 with $150 million of authorized capital as a “fund-less” sponsor. We also created Gabelli Principal Strategies Group, LLC (“GPS”) in December 2015 to pursue strategic operating initiatives.
Operating Loss Before Management Fee
Operating loss before management fee expense represents a non-GAAP financial measure used by management to evaluate its business operations. We believe this measure is useful in illustrating the operating results of the Company as management fee expense is based on pre-tax income before management fee expense, which includes non-operating items including investment gains and losses from the Company’s proprietary investment portfolio and interest expense.
Year-to-date ($ in 000’s) 2023 2022 Operating loss – GAAP $ (16,947 ) $ (11,262 ) Add: management fee expense(1) 5,446 - Operating loss before management fee – Non-GAAP $ (11,501 ) $ (11,262 ) (1) Management fee expense is incentive-based and is equal to 10% of Income before management fee and income taxes and excludes the impact of consolidating entities. For the year ended December 31, 2023 and 2022, Income before management fee, income taxes and excluding consolidated entities was income of $54,456 and loss of $63,850, respectively. As a result, $5,446 was accrued for the 10% management fee expense in 2023. There was no management fee accrual in 2022 due to the loss in that period.
Table IASSOCIATED CAPITAL GROUP, INC. UNAUDITED CONDENSED CONSOLIDATED STATEMENTS OF FINANCIAL CONDITION (Amounts in thousands) December 31,
2023December 31,
2022ASSETS Cash, cash equivalents and US Treasury Bills $ 406,642 $ 404,463 Investments in securities and partnerships 420,706 435,610 Investment in GAMCO stock 45,602 36,683 Receivable from brokers 16,005 12,072 Receivable from brokers (cash held for real estate purchase) 14,263 - Income taxes receivable, including deferred tax assets, net 8,474 10,320 Other receivables 5,587 6,324 Other assets 26,518 22,218 Total assets $ 943,797 $ 927,690 LIABILITIES AND EQUITY Payable to brokers $ 4,459 $ 7,784 Compensation payable 15,196 13,936 Securities sold short, not yet purchased 5,918 2,874 Accrued expenses and other liabilities 5,173 2,707 Sub-total $ 30,719 $ 27,301 Redeemable noncontrolling interests 6,103 10,193 Total Associated Capital Group, Inc. equity 906,975 890,196 Total liabilities and equity $ 943,797 $ 927,690 Notes:
(1) Certain captions include amounts related to a consolidated variable interest entity ("VIE") and voting interest entity ("VOE"). Refer to the Consolidated Financial Statements included in the 10-K report to be filed for the year ended December 31, 2023 for more details on the impact of consolidating these entities.(2) Investment in GAMCO stock: 2,386,295 and 2,407,000 shares, respectively.
Table II
ASSOCIATED CAPITAL GROUP, INC. UNAUDITED CONDENSED CONSOLIDATED STATEMENTS OF INCOME (Amounts in thousands, except per share data) Three Months Ended
December 31,Year Ended
December 31,2023 2022 2023 2022 Investment advisory and incentive fees $ 5,535 $ 7,392 $ 12,324 $ 14,801 Other 101 146 359 427 Total revenues 5,636 7,538 12,683 15,228 Compensation 5,809 8,352 17,246 18,883 Other operating expenses 2,278 1,802 6,938 7,607 Total expenses 8,087 10,154 24,184 26,490 Operating loss before management fee (2,451 ) (2,616 ) (11,501 ) (11,262 ) Investment gain/(loss) 21,398 16,214 43,033 (56,513 ) Interest and dividend income from GAMCO 96 97 384 446 Interest and dividend income, net 7,591 4,952 24,412 9,971 Shareholder-designated contribution (2,413 ) (1,713 ) (4,017 ) (3,127 ) Investment and other non-operating income/(expense), net 26,672 19,550 63,812 (49,203 ) Income/(loss) before management fee and income taxes 24,221 16,934 52,311 (60,465 ) Management fee 2,371 - 5,446 - Income/(loss) before income taxes 21,850 16,934 46,865 (60,465 ) Income tax expense/(benefit) 5,551 2,855 9,137 (14,943 ) Income/(loss) before noncontrolling interests 16,299 14,079 37,728 (45,522 ) Income/(loss) attributable to noncontrolling interests (43 ) 415 277 3,385 Net income/(loss) attributable to Associated Capital Group, Inc.’s shareholders $ 16,342 $ 13,664 $ 37,451 $ (48,907 ) Net income/(loss) per share attributable to Associated Capital Group, Inc.’s shareholders: Basic $ 0.76 $ 0.62 $ 1.72 $ (2.22 ) Diluted $ 0.76 $ 0.62 $ 1.72 $ (2.22 ) Weighted average shares outstanding: Basic 21,576 21,998 21,771 22,024 Diluted 21,576 21,998 21,771 22,024 Actual shares outstanding – end of period 21,538 21,990 21,538 21,990 SPECIAL NOTE REGARDING FORWARD-LOOKING INFORMATION
The financial results set forth in this press release are preliminary. Our disclosure and analysis in this press release, which do not present historical information, contain “forward-looking statements” within the meaning of the U.S. Private Securities Litigation Reform Act of 1995. Forward-looking statements convey our current expectations or forecasts of future events. You can identify these statements because they do not relate strictly to historical or current facts. They use words such as “anticipate,” “estimate,” “expect,” “project,” “intend,” “plan,” “believe,” and other words and terms of similar meaning. They also appear in any discussion of future operating or financial performance. In particular, these include statements relating to future actions, future performance of our products, expenses, the outcome of any legal proceedings, and financial results. Although we believe that we are basing our expectations and beliefs on reasonable assumptions within the bounds of what we currently know about our business and operations, the economy and other conditions, there can be no assurance that our actual results will not differ materially from what we expect or believe. Therefore, you should proceed with caution in relying on any of these forward-looking statements. They are neither statements of historical fact nor guarantees or assurances of future performance.
Forward-looking statements involve a number of known and unknown risks, uncertainties and other important factors, some of which are listed below, that are difficult to predict and could cause actual results and outcomes to differ materially from any future results or outcomes expressed or implied by such forward-looking statements. Some of the factors that could cause our actual results to differ from our expectations or beliefs include a decline in the securities markets that adversely affect our assets under management, negative performance of our products, the failure to perform as required under our investment management agreements, and a general downturn in the economy that negatively impacts our operations. We also direct your attention to the more specific discussions of these and other risks, uncertainties and other important factors contained in our Form 10 and other public filings. Other factors that could cause our actual results to differ may emerge from time to time, and it is not possible for us to predict all of them. We do not undertake to update publicly any forward-looking statements if we subsequently learn that we are unlikely to achieve our expectations whether as a result of new information, future developments or otherwise, except as may be required by law.
Ian J. McAdams
Chief Financial Officer
(914) 921-5078
Associated-Capital-Group.comPhotos accompanying this announcement are available at
https://www.globenewswire.com/NewsRoom/AttachmentNg/215bf170-384b-477c-8e18-4486e88ebd62https://www.globenewswire.com/NewsRoom/AttachmentNg/68d5ed85-61a8-47d0-a632-9a7d6f457e38
https://www.globenewswire.com/NewsRoom/AttachmentNg/0f36ea00-c57e-4b8b-b011-b6fb5b94794b
https://www.globenewswire.com/NewsRoom/AttachmentNg/4bb3dcbf-3840-4181-99d0-001146636cca

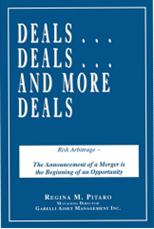
Deals...Deals...And More Deals

Risk Arbitrage - The Announcement of a Merger is the Beginning of an Opportunity
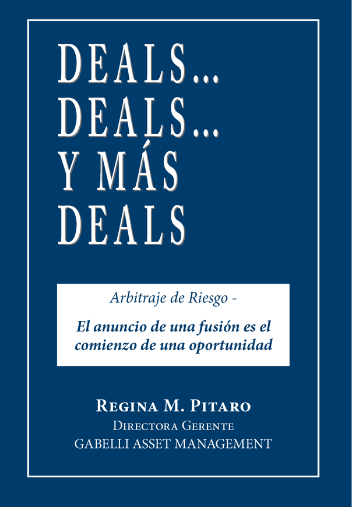
Deals...Deals...Y Más Deals

Arbitraje de Riesgo - El anuncio de una fusión es el comienzo de una oportunidad
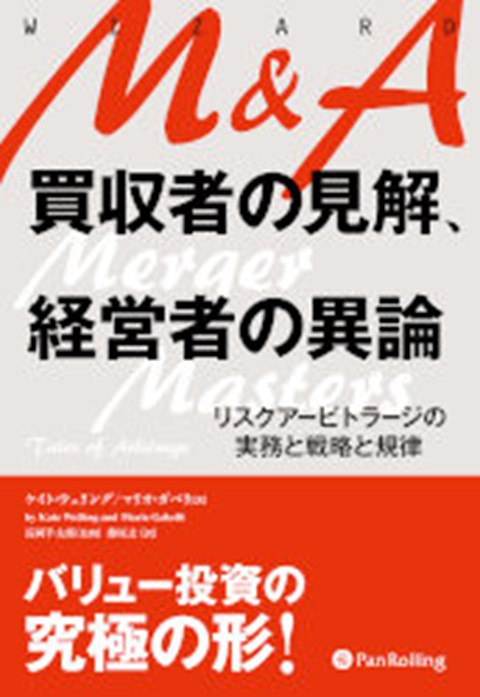
Merger Masters
Tales of Arbitrage
Merger Masters (Japanese)

Tales of Arbitrage
- Book Value was $42.11 per share at year-end 2023 vs. $40.48 a year ago